Summary: Latitude vs. X

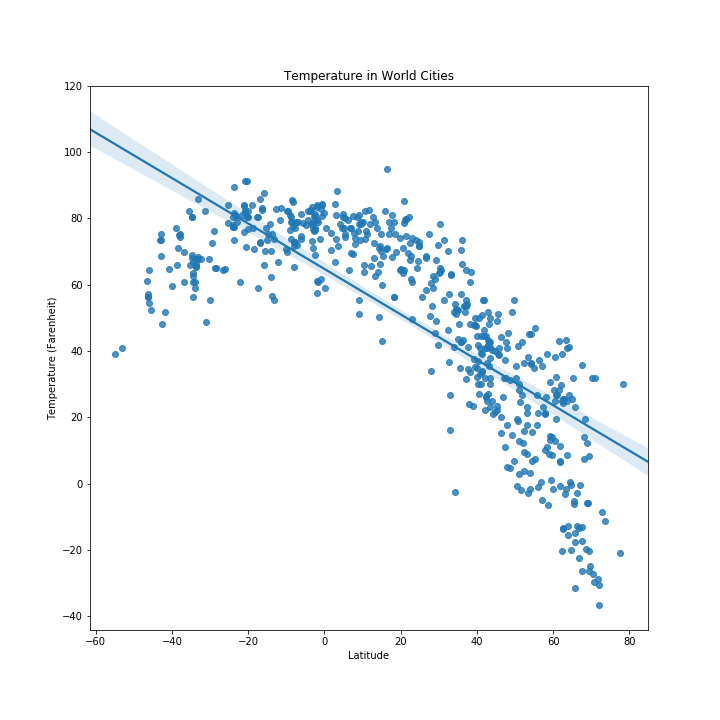
A weather analysis that uses data to show how weather changes as you get closer to the equator.
Starting with random sample of latitude and longitude values (approx 1600+), a collection of 500+ cities was generated. The near_by functionality of citypy was used to select the list of unique cities. We started with a higher number of coordinates as some coordinates would match to the same city, our goal was to obtain a collection of at least 500 cities.
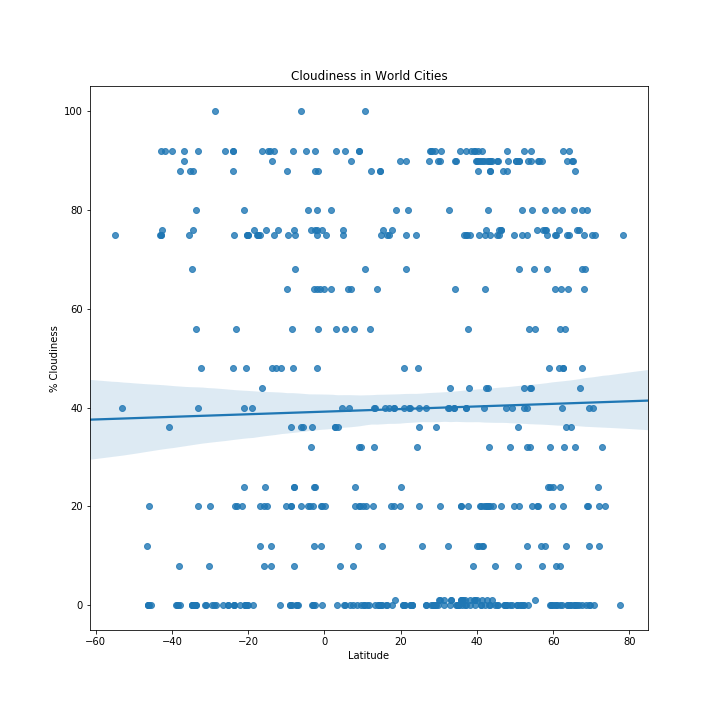
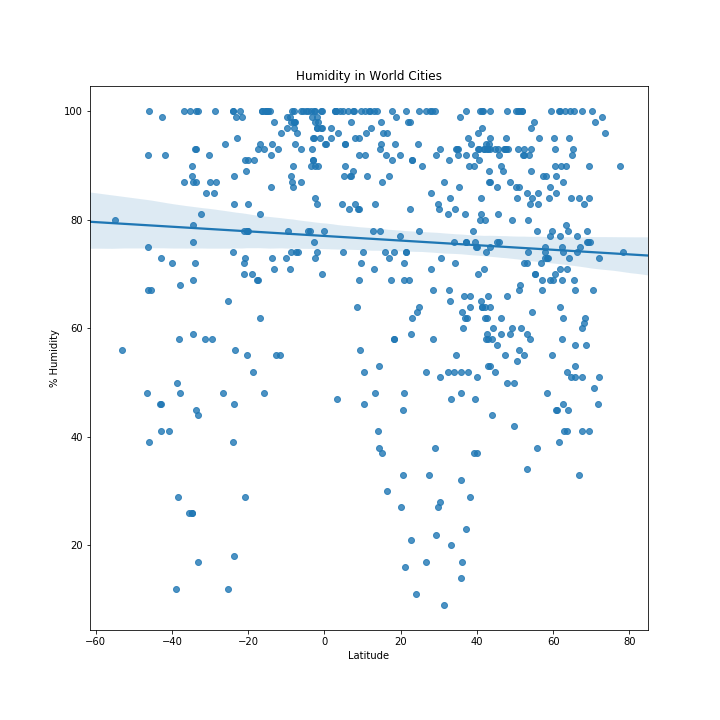
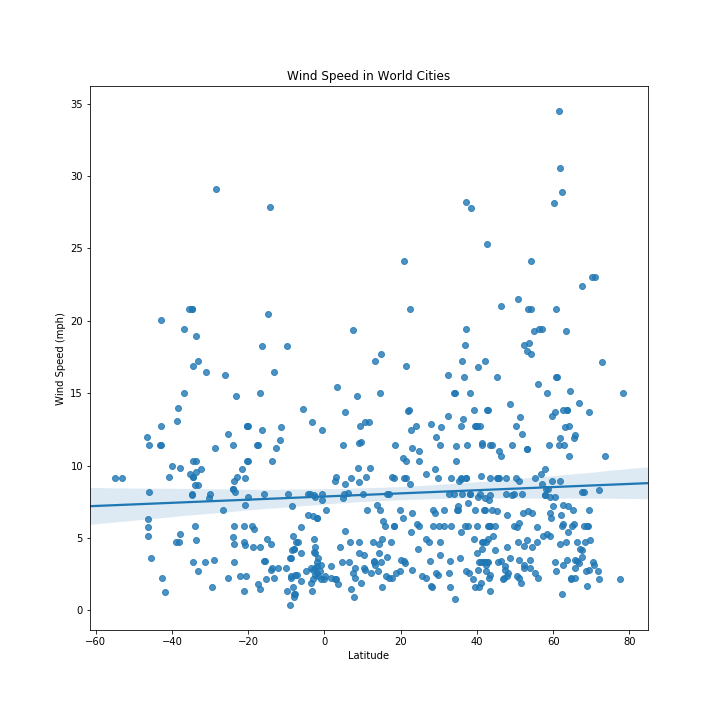
Using OpenWeatherMap API we assembled a dataset that consist of weather parameters such as temperature, cloudiness, wind speed, and humidity for each of the cities from our collection. We used the current data requests from OpenWeatherMap API to assemble the dataset.Matplotlib is used to plot the various aspects of the weather vs latitue.
This site provides the source data and visualizations created as part of the analysis, as well as explanations and descriptions of any trends and correlations. The source code is available in PyWeather


